HiPERiSM - High Performance Algorism Consulting
HCTR-2005-1: Compiler Performance 14
PERFORMANCE ANALYSIS OF AERMOD ON COMMODITY PLATFORMS
George Delic
HiPERiSM Consulting, LLC.
1. INTRODUCTION
This is a progress report on a project to evaluate industry standard fortran 90/95 compilers for IA-32 Linux™ commodity platforms when applied to Air Quality Models (AQM). The goal is to determine the optimal performance and workload though-put achievable with commodity hardware for such models because they are in wide-spread use on these platforms. New results are presented for AERMOD that give insight into the algorithm’s performance on commodity architectures. Important performance bottle-necks are identified with the aid of proprietary software to collect and compute performance metrics using a publicly available hardware performance interface. These studies are intended to quantitatively measure performance differences as hardware and programming environments change and to relate these differences to the underlying causes.
2.0 CHOICE OF HARDWARE, OPERATING SYSTEM, AND COMPILERS
The hardware used for the results reported here is the Intel Pentium 4 Xeon (P4) and Pentium Xeon 64EMT (P4e) processors. These have processor clock rates of 3GHz and 3.4GHz, respectively. Each is in a dual configuration with a corresponding front side bus (FSB) of 533MHz and 800HMz shared by each pair of processors. The operating system (OS) is HiPERiSM Consulting, LLC’s modification of the Linux™ 2.6.9 kernel to include a patch that enables access to hardware performance counters. This modification allows the use of the Performance Application Programming Interface (PAPI) performance event library (PAPI, 2005) to collect hardware performance counter values as the code executes. The performance metrics are defined with a view to giving insight into how the application is mapped to the architectural resources by a compiler. The compilers used were the Portland pgf90/95 (release 6.0), Intel ifort (release 9.0), and Absoft f90/f95 (release 9.0). The choice of optimization switches are shown in Table 1 where mnemonics pgf-60, ifc-60, and abf-90 are introduced for the respective compilers. This table also shows that there is wide variability in the compilation times.
These architectures offer Streaming Single-Instruction-Multiple-Data Extensions (SSE) to enable vectorization of loops operating on multiple elements in a data set with a single operation. This is enabled through a compiler switch (see Table 1) and has been used in these tests. Additional optimizations are available with these compilers and will be mentioned as needed. However, they did not significantly change the results presented here for AERMOD.
|
Table 1. Compiler command and switches |
|||
|
Compiler and platform* |
Compiler optimization switches |
Switch group mnemonic** |
|
|
pgf95 (P4:115s) pgf95 (P4e:383s) |
–fast –Mvect=sse –tp p7 |
pgf-60-sse-p4 |
|
| –fast –Mvect=sse –tp p7-64 | pgf-60-sse-p4e | ||
|
ifort (P4:27s) ifort (P4e:31s) |
-tpp7 -xW -O3 -Ob0 -prefetch- -FI |
ifc-90-sse-p4 |
|
|
-tpp7 -xW -O3 -Ob0 -prefetch- -FI |
ifc-90-sse-p4e |
||
|
f90 (P4:52s) f90 (P4e:68s) |
-cpu:p7 -O3 –s -ffixed |
abf-90-sse-p4 |
|
|
-cpu:p7 -O3 –s -ffixed |
abf-90-sse-p4e |
||
|
* Note that the P4 platform has a 32-bit Linux OS kernel and compilers, while the P4e has a 64-bit Linux OS kernel and 64-bit versions of each compiler. Compile times (in seconds) are shown in the parentheses. ** This mnemonic is used in the following discussion. |
|||
3.0 CHOICE OF BENCHMARKS
The AERMOD code describes pollutant dispersion and deposition and is proposed as a next-generation regulatory model for new source reviews and other permitting applications. It is predominantly a Fortran 77 code developed over ten years ago but has since used (in small part) Fortran 90 features. As such, and typical of that generation of environmental models, AERMOD was developed on a PC platform, with a small memory requirement, poor vector character, and I/O bound performance characteristics. The code has good potential for parallelism, but the conversion task is complicated due to an elaborate call tree that also inhibits vectorization due to multiple levels of procedure calls within loop structures. AERMOD and other AQM’s are available at the U.S. EPA’s Support Center for Regulatory Air Models (EPA-SCRAM).
AERMOD, enjoys constant use with scenarios that may require weeks of wall clock time and for this reason there is considerable interest in finding ways to improve performance. The benchmark used in this analysis is a “small” scenario that completes in less than an hour. Performance results and analysis for earlier versions of the Portland and Intel compilers have been presented elsewhere (Delic, 2005).
4.0 HARDWARE PERFORMANCE EVENTS
The PAPI (PAPI, 2005) interface defines over a hundred hardware performance events, but not all of these events are available on all platforms. For the Intel hardware under discussion the number of hardware events that can be collected are, respectively, 28 (P4) and 25 (P4e) and Table 2 shows only events that are common to them. Not all events can be collected in a single execution due to the fact that the number of hardware counters is small (typically four). Thus, multiple executions are needed to collect all available events on any given platform. Performance metrics are defined using the PAPI events and measured in the expectation that they will give insight into how resource utilization differs between compilers. The process time (PTIME) reported here is obtained from the hardware performance counter interface.
5.0 PERFORMANCE METRICS
5.1 Rate performance metrics
Rate metrics have the suffix “_rate” (except for MFLOPS) and some examples include TOT_CYC_rate, TOT_INS_rate, BR_INS_rate, L1_ICA_rate, and TLB_ICM_rate. This naming convention uses the corresponding PAPI event name in Table 2 divided by the process time (usually in units of million per second). The following discussion will use those rate metrics of relevance in identifying bottle-necks in AERMOD.
|
Table 2. PAPI events common to the Intel P4 and P4e. |
||
|
Category |
Description |
Name |
|
Floating Point Operations |
Floating point instructions |
PAPI_FP_INS |
|
Floating point operations |
PAPI_FP_OPS |
|
|
Instruction Counting |
Total cycles |
PAPI_TOT_CYC |
|
instructions issued |
PAPI_TOT_IIS |
|
|
instructions completed |
PAPI_TOT_INS |
|
|
Vector/SIMD instructions |
PAPI_VEC_INS |
|
|
Conditional branching instructions |
Total |
PAPI_BR_INS |
|
Mispredicted |
PAPI_BR_MSP |
|
|
Correctly predicted |
PAPI_BR_PRC |
|
|
Taken |
PAPI_BR_TKN |
|
|
Not taken |
PAPI_BR_NTK |
|
|
Data Access |
Load instructions |
PAPI_LD_INS |
|
Store instructions |
PAPI_SR_INS |
|
|
Load/store instructions |
PAPI_LST_INS |
|
|
Cycles stalled on any resource |
PAPI_RES_STL |
|
|
Cache Access |
L1 data cache misses |
PAPI_L1_DCM |
|
L1 load misses |
PAPI_L1_LDM |
|
|
L1 instructions Cache accesses |
PAPI_L1_ICA |
|
|
L1 instructions cache misses |
PAPI_L1_ICM |
|
|
L2 load misses |
PAPI_L2_LDM |
|
|
L2 store misses |
PAPI_L2_STM |
|
|
L2 total cache misses |
PAPI_L2_TCM |
|
|
Translation lookaside buffer (TLB) Operations |
Total TLB misses |
PAPI_TLB_TL |
|
Data TLB misses |
PAPI_TLB_DM |
|
|
Instruction TLB misses |
PAPI_TLB_IM |
|
5.2 Profiling and code performance
While not a metric, execution profiling is useful in determining where “hot spots” occur in the source code by measuring (cumulative) time consumed during the code execution. A profile of AERMOD is discussed to identify the code characteristics.
6.0 AERMOD PERFORMANCE RESULTS
6.1 Operations, instructions, and cycles
Fig. 1 shows the process time for AERMOD on P4 and P4e platforms. The left and right hand half of Fig. 1 shows, respectively, the P4 and P4e results. Each group of executions corresponds to the choice of compiler switches listed in Table 1. Comparing the results on the two platforms shows the shortest times are for the abf-90 cases with 1,597and 1,226 seconds, respectively. The inter-procedural analysis (IPA) optimizations have not been enabled because ifc-90 will not produce an executable when fortran and C language modules are used together and –ipo is enabled. The C language modules are required to collect performance events. However, with these removed, and the –ipo switch enabled for ifort, the execution time on the P4e for ifc-90 is only reduced from 1,509 to 1,464 seconds (a 3% change). Compared to this the Absoft f90 v9.0 compiler is still 16% faster.
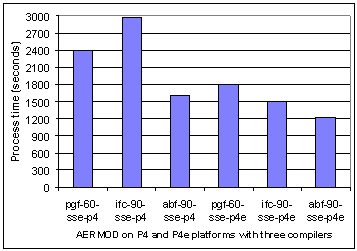 Fig. 1. Process time for AERMOD with pgf, ifc, and abf compilers on P4 and P4e processors (left and right half, respectively). Each compiler has the group of compiler switches defined in Table 1. |
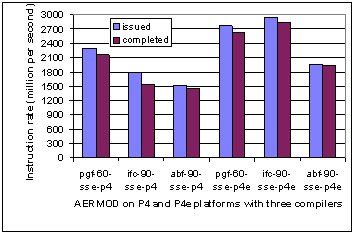 Fig. 2. Rates of instructions issued and completed for AERMOD with pgf, ifc, and abf compilers on P4 and P4e processors (left and right half, respectively). Each compiler has the group of compiler switches defined in Table 1. |
Fig. 2 shows the instruction rates for instructions issued and completed by AERMOD on P4 and P4e platforms with the three compilers. The obvious feature is that the afb-90 compiler has the lowest values on both platforms.
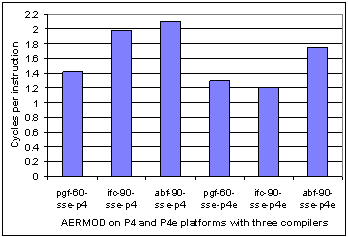 Fig. 3. Cycles per instruction for AERMOD with pgf, ifc, and abf compilers on P4 and P4e processors (left and right half, respectively). Each compiler has the group of compiler switches defined in Table 1. |
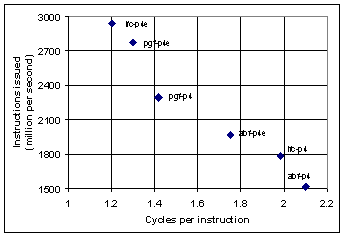 Fig. 4. Instruction issue rate versus cycles per instruction for AERMOD with pgf, ifc, and abf compilers on P4 and P4e processors. Each compiler has the group of compiler switches defined in Table 1. |
Another interesting metric related to instructions is the number of cycles per instruction (CPI). This is the mean number of cycles between instruction issue. Fig. 3 shows the CPI of all three compilers on both platforms and the largest CPI value is for the compiler with the lowest execution time. For another view, Fig. 4 shows instructions issued versus CPI. The CPI metric is not an unambiguous indicator since, for example, it does not sufficiently different ifc-p4 and abf-p4. However, the problem size is fixed in this benchmark and therefore the same amount of total work is performed by all three compilers. They differ only in how they allocate resources to perform this work. i.e., how each compiler maps the application to the architecture. Thus, qualitatively, a larger CPI value means that more operations are performed per instruction. It is instructive to further investigate the possible sources of this execution time difference between the three compilers at the hardware event level.
The sse optimizations allow the compiler on 64 bit hardware (with a 64 bit kernel) to use the enhanced sse instruction set. This approach takes advantage of the availability of considerably more hardware resources on the P4e compared to the P4. For this reason all three compilers have sse optimizations enabled. However, this gives little performance gain for AERMOD because of the lack of vector loop structure and the predominance of control transfer instructions (as discussed below). One side effect when sse instructions predominate is that the values reported by the PAPI event counter PAPI_MFLOPS under-estimates Mflops. This is because this counter uses floating point operation counts and not sse events. Nevertheless a simple estimate of Mflops is shown in Table 3 where it is evident that the range is approximately a factor of two from pgf-60-sse-p4 to abf-90-sse-p4e.
|
Table 3: Mflops estimates for P4 and P4e |
||
|
Switch group mnemnonic |
Execution time (seconds) |
Mflops |
|
pgf-60-sse-p4 |
2391 |
230 |
|
ifc-90-sse-p4 |
2976 |
185 |
|
abf-90-sse-p4 |
1597 |
344 |
|
pgf-60-sse-p4e |
1793 |
307 |
|
ifc-90-sse-p4e |
1509 |
365 |
|
abf-90-sse-p4e |
1226 |
449 |
One type of control transfer instructions, namely, branch instruction rates, is shown in Fig. 5 for AERMOD on P4 and P4e platforms. The left and right hand half of Fig. 5 shows, respectively, the P4 and P4e results. The lowest values observed are for the Absoft f90 compiler. It was noted previously (Delic, 2005) that AERMOD reports branch instruction rates that are more than an order of magnitude larger than those shown by good vector code on the same platforms. Therefore, the fact that the Absoft compiler optimizations reduce the branch instruction rates correlates positively with higher Mflops rates. Presumably a reduction of this type of control transfer instructions is due to a more efficient use of hardware resources when compared to the other two compilers.
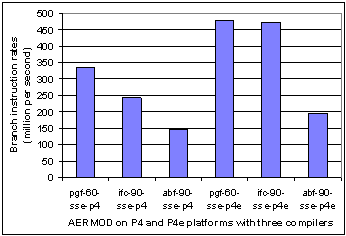 Fig. 5. Branch instruction rates for AERMOD with pgf, ifc, and abf compilers on P4 and P4e processors (left and right half, respectively). Each compiler has the group of compiler switches defined in Table 1. |
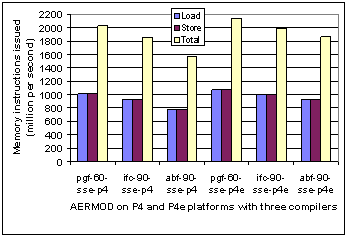 Fig. 6. Memory instruction rates for AERMOD with pgf, ifc, and abf compilers on P4 and P4e processors (left and right half, respectively). Each compiler has the group of compiler switches defined in Table 1. |
6.2 Memory footprint
In comparing performance of compilers and processors the memory behavior is of special interest. Fig. 6 shows instruction rates for load (LD_INS_rate), store (SR_INS_rate), and the sum of the two (MEM_TOT_rate). In general, the rate of total memory instructions issued is voluminous. A high rate of memory instruction issue need not be an indicator of a performance bottleneck. Benchmarks with good vector character that deliver of the order of 1Gflop on a P4 can also show high memory access rates. However, what is interesting (and important for the case of AERMOD) is that the compiler with the lowest execution time is also the one with the lowest memory instruction rate. The fact that these two metrics correlate should not be surprising because the commodity architectures compromise on memory bandwidth and latency. Thus, a memory intensive application, without a dominant vector code character (as is AERMOD), is performance constricted on commodity architectures where memory bandwidth is limited by the FSB and cache design. The consequence of AERMOD’s memory footprint is that the path to memory can become a limiting critical resource and this is explored in the next two sections.
6.3 TLB cache usage
Between the processor and the first level of cache (L1) there is the TLB cache. The translation lookaside buffer (TLB) is a small buffer (or cache) to which the processor presents a virtual memory address and looks up a table for a translation to a physical memory address. If the address is found in the TLB table then there is a hit (no translation is computed) and the processor continues. The TLB buffer is usually small, and efficiency depends on hit rates as high as 98%. If the translation is not found (a TLB miss) then several cycles are lost while the physical address is translated. Therefore TLB misses degrade performance. PAPI offers counters for TLB miss events for both instruction and data (see Table 2). In the case of AERMOD it is the instruction TLB misses that are critical because of the voluminous incidence of control transfer instructions due to procedure calls (see Section 7).
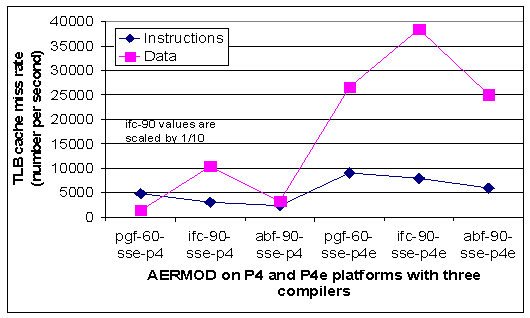 |
Fig. 7. Instruction and data TLB cache miss rates for AERMOD with pgf, ifc, and abf compilers on P4 and P4e processors (left and right half, respectively). Each compiler has the group of compiler switches defined in Table 1. |
Fig. 7 shows the instruction and data TLB miss rates observed for AERMOD with the three compilers on the P4 and P4e platforms. From this graph it is clear that the execution with the shortest time has the lowest number of instruction TLB cache misses in each group of three compilers, whereas there is no simple trend with the data TLB miss rates. To see this correlation more clearly, Fig. 8 shows the execution time versus the instruction TLB miss rate for the three compilers on the P4e platform. Higher instruction TLB miss rates suggest that the processor pipeline stalls more frequently because of a higher rate of control transfer instructions. It appears that the Absoft compiler is more efficient in reducing instruction TLB miss rates through optimization and resource allocation compared to the other two compilers. However, a complete explanation of AERMOD behavior is more subtle, and depends also on cache performance.
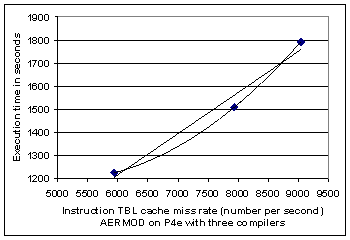 Fig. 8. Execution time versus the instruction TLB cache miss rate for AERMOD with pgf, ifc, and abf compilers on the P4e processor. Each compiler has the group of compiler switches defined in Table 1. Linear and quadratic regression lines are added to show that process time increases with increasing instruction TLB miss rate. |
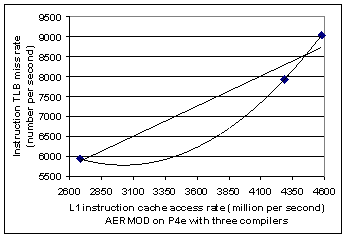 Fig. 9. Instruction TLB cache miss rate versus L1 cache access rate for AERMOD with pgf, ifc, and abf compilers on the P4e processors. Each compiler has the group of compiler switches defined in Table 1. Linear and quadratic regression lines are added to show that the cache access rate increases with increasing instruction TLB miss rate. |
6.4 Cache usage
Both the P4 and P4e platforms discussed here have L1 and L2 caches. A cache miss on either of these occurs when data or instructions are not found in the cache and an excursion to higher level cache, or memory, is necessitated. Cache misses result in lost performance because of increasing latency in the memory hierarchy. Memory latency is smallest at the register level and increases by an order of magnitude for a L1 cache reference, and another order of magnitude to access L2 cache. In the case of AERMOD this analysis will focus on the L1 cache behavior.
There is another view of the penalties associated with excursions to cache by the processor. Fig. 9 shows the relationship between instruction TLB miss rates and L1 instruction cache access rates. Clearly, increased instruction TLB rates also lead to increased L1 instruction cache access rates.
This suggests that the extremely high data TLB misses for AERMOD are a critical source of performance limitations. They lead to very high memory instruction rates due in part to high TBL instruction miss rates and also in part due to correlated L1 instruction cache miss rates. This behavior results directly from the profile of the AERMOD execution and is ameliorated by the efficiency of the Absoft compiler in minimizing the consequences of this behavior.
7.0 AERMOD EXECUTION PROFILE
AERMOD consists of just under 50,000 lines of fortran code of which 49% are comments and 51% is executable code. There are some 400 subprograms and a calling tree that is some six levels deep.
An execution profile of AERMOD is easily performed with the –Mprof=lines compiler switch in the pgf90/95 compiler. Results are shown in Table 4 with those functions that account for 95% of the cumulative process time. Once the important functions are identified code inspection shows some reasons why vector instructions are scarce in AERMOD and why control transfer instructions are numerous.
In Table 4 the top two routines account for 36% of the total execution time and there is a long list of called procedures. Of these, half of the execution time is spent in procedures that have less than 100 lines of executable code, and typically 58 executable lines. Furthermore, these procedures occur at the leaves of a deep calling tree and they invariably have no loop structure but consist of simple arithmetic statements and conditional code blocks. These are the reasons for lack of vectorizable loops and the high rates of branching instructions. The other important feature in Table 4 is the voluminous number of calls between these procedures that do little computation per call. Hence the origin of high rates of instruction TLB misses.
|
Table 4. AERMOD P4 profile for pgf |
||||||||||||||||||||||||||||||||||||||||||||||||||||||||||||||||||||
|
Function |
Number of calls |
Time (%) |
||||||||||||||||||||||||||||||||||||||||||||||||||||||||||||||||||
|
|
||||||||||||||||||||||||||||||||||||||||||||||||||||||||||||||||||||
|
|
|
||||||||||||||||||||||||||||||||||||||||||||||||||||||||||||||||||
Of the list of functions shown in Table 4 those that account for a small amount of the process time, but have a very high calling overhead, should be in-lined to reduce the high cost of control transfer instructions. In-line method are available at the compiler command line level but interprocedural optimizations when tried gave little improvement. Thus the enhancement of vectorization opportunities combined with manual inlining would require source code modifications.
Another important source of control transfer instructions is I/O but this has not been studied here and is still an open issue.
8.0 CONCLUSIONS
This performance analysis of AERMOD, shows that it is a memory intensive application with large rates of control transfer instructions such as branching logic and high procedure calling overhead. These features result in large observed rates for branching instructions and instruction TLB misses. In combination these two characteristics of the AERMOD code place a limit on the optimal performance possible from AERMOD on commodity platforms. This is because, by design, commodity hardware solutions offer a cost effective compromise between processor clock rates, cache size, and bandwidth (or latency) to memory.
In its present form, AERMOD gains mostly from improvements in the scalar performance of the hardware. But, despite these observations, a profile of AERMOD performance, followed by code inspection, does suggest that there is scope for performance improvement beyond the range it currently delivers on the P4 and P4e platforms.
The important result of this analysis is that by simply changing hardware platforms and compilers it is possible to see performance enhancement by as much as a factor of two. At this time the best results were delivered by the Absoft f90 v9.0 compiler on the P4e platform.
REFERENCES
EPA-SCRAM: U.S. EPA, Technology Transfer Network, Support Center for Regulatory Air Models http://www.epa.gov/scram001/.
PAPI, 2005: Performance Application Programming Interface, http://icl.cs.utk.edu/papi. Note that the use of PAPI requires a Linux kernel patch (as described in the distribution).
Delic, 2005: George Delic, Performance Metrics for Ocean and Air Quality Models on Commodity Linux Platforms, presented at the 6th International Conference on Linux Clusters: The HPC Revolution 2005, Chapel Hill, NC, April 26-28, 2005. http://www.linuxclustersinstitute.org/Linux-HPC-Revolution/Archive/2005techpapers.html
HiPERiSM Consulting, LLC, (919) 484-9803 (Voice)
(919) 806-2813 (Facsimile)


